
The future market for stationary energy storage systems (ESS) is one of the most heavily discussed topics in the power industry today. Significant growth is expected in particular for stationary battery systems, which accounted for only 2 GWh globally in 2015 but is expected to grow to 33 GWh by the end of the decade.
One of the key drivers – and prerequisites – of this growth is a significant cost decrease and the resulting competitiveness of energy storage systems compared to traditional, non-storage solutions. At the same time, an increasing number of ESS technologies has become available for commercial application in a variety of use cases, each with a different cost of energy storage that needs to be compared thoroughly.
But what does “cost of energy storage” really mean?
While there is general consensus to use levelized cost of energy (LCOE) for comparing different energy generation technologies, such as solar parks, wind farms and coal plants, there is no universally applied metric for calculating the cost of energy storage. As a result, the assessment of costs for different energy storage solutions can become a tough exercise for all stakeholders: storage system manufacturers have a hard time explaining cost advantages over their competition, investors struggle with making an educated decision for financing and end users do not know which energy storage solution is most economical in the targeted application.
In this article, we will examine what to consider for calculating meaningful, comparable ESS costs.
Cost comparison for same use cases only
In contrast to technologies for generation, which have a single application (i.e., the generation of electricity), energy storage technologies serve a variety of use cases, including both front-of-the-meter (e.g., supply of reserve power, black start support, dispatchable PV) and behind-the-meter applications (e.g., increase of self-consumption, peak shaving). Each use case requires different operating parameters which affect the costs and each technology optimizes into these parameters differently according to its relative strengths and weaknesses.
Therefore, cost comparisons of energy storage only make sense for a common and clearly defined use case. Furthermore, the costs should be put in relation to the value energy storage is adding in the specific use case, such as providing energy (kWh, MWh) or power capacity (kW, MW).
In the following, we focus on calculating the cost of ESS in providing energy.
Know your cost influencers
The key to comparing apples with apples is to make sure that individual cost figures are calculated at the same level of detail and are based on comparable assumptions. The prerequisite for this is a deep understanding of the different factors influencing the costs of an ESS, i.e., upfront costs, O&M costs, charging costs, usable energy over lifetime, residual value and financing costs.
Upfront costs: Already at this fundamental level, a close look is required when comparing different energy storage solutions. Are all necessary investments for the complete and connected system included in the initial quote? Very often, for example, costs for the necessary DC/AC inverters, safety engineering or for shipping and installation are not covered.
O&M costs: Like all infrastructure assets, energy storage requires periodic minor and major servicing. Depending on the components that need to be replaced, and how frequently, this can cause significant additional technology-specific costs. For example, a redox-flow battery features mechanical parts such as pumps that can require maintenance efforts not needed for other battery technologies.
Charging costs: The costs of charging the ESS need to be taken into consideration, but are often left out. Efficiency losses during a complete charge-discharge cycle (i.e., low roundtrip efficiencies) mean that more energy has to be purchased at a certain price for charging the ESS than can be sold when discharging – often constituting a significant cost factor depending on the charging electricity price.
Also, energy consumption of the ESS is very different from technology to technology and should be included in the costs. For example, many Li-ion chemistries require power consuming air-conditioning to maintain favorable operating temperatures.
Usable energy over the lifetime: As mentioned earlier, the cost of an ESS with purpose of providing energy should be put in relation to the energy output expected over the lifetime. For batteries, the lifetime mostly refers to the projected cycle lifetime, which is the number of complete charge-discharge cycles a battery is expected to perform before its nominal capacity falls below 80% of its initial rated capacity as a result of continuous degradation.
Different storage types claim different cycle lifetimes. It is important to understand that a very high number of projected cycles is not necessarily an advantage, depending on the cycles required per year and the ESS’ calendar life. The cycles required per year are determined by the individual use case, calendar life is simply the elapsed time before a storage solution becomes unusable whether it is in active use or inactive. For example, if a battery has a calendar life of 20 years and the targeted use case requires only one cycle per day, a cycle lifetime of 365*20 = 7,300 cycles would be sufficient – anything beyond does not add extra value and should not be included in the cost calculation. If the remunerations to be received are limited to a period shorter than the calendar life, e.g., in case of a PPA, the relevant number of years is reduced even further.
For batteries, the usable energy greatly depends on the depth of discharge or DOD. For most chemistries, the lower the DOD applied, the higher the number of cycles and the roundtrip efficiency (see above) – but obviously the lower the amount of energy that can be discharged in each cycle as well. Consequently, cost figures should not only include the number of cycles and roundtrip efficiency, but also the corresponding DOD.
Residual value: Even after an ESS has reached the end of its lifetime, it bears a certain residual value based on the achievable sales price for the individual components including inverters, switchgear and transformers. Obviously, the shorter the period of time an ESS has been used, the higher the residual value.
Financing costs: The time value of money dictates that time has an impact on the value of cash flows. In other words, future cash flows related to an ESS have a lower present value than cash flows generated today. Therefore a discount factor reflecting the financing costs, typically the weighted average cost of capital (WACC), needs to be applied to all outflowing (i.e., O&M and charging) and inflowing cash (i.e., the remuneration for the usable energy and residual value).
Levelized cost of stored energy
In order to reflect all of the cost influencers explained above in a simple metric, it makes sense to assume a constant – or levelized – price per kWh over the applicable lifetime of the ESS. The resulting cost metric is called Levelized Cost of Stored Energy (LCOS). In other words, the LCOS is the constant, thus levelized price per kWh at which the net present value of the ESS project is zero.
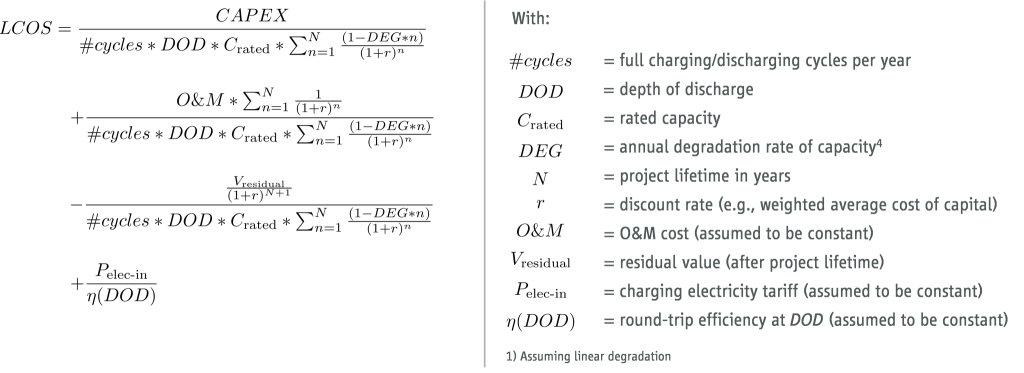
Although a bit counterintuitive, it is important to “discount” also the usable energy (electricity discharged), as can be seen in the derivation of the LCOS formula below:

The LCOS formula can be structured along the individual components of CAPEX, O&M, residual value and charging costs:
By applying LCOS, the significant impact of including or leaving out any of the described cost influencers becomes obvious, as illustrated in the graph below.

For the use case of dispatchable PV, i.e., shifting PV generated electricity to the evening to meet peak demand, a Li-ion battery would end up at LCOS of 35 USD¢/kWh. When compared to non-storage solutions such as fossil-based generation, Li-ion would only be economically viable for this use case in a limited number of markets with very high LCOE of fossil plants. Everywhere else, use of Li-ion will have to be justified by addressing multiple use cases with the same battery to generate additional revenue streams and cost synergies, i.e., benefit stacks. Looking forward, the overall trend of decreasing LCOS will continue to increase the competitiveness of energy storage solutions.
Implications for energy storage stakeholders
As outlined above, it is most important to be aware of the various factors influencing ESS costs and how to consider them in the right way depending on the individual use cases. In this context, LCOS is an easily calculable while sufficiently detailed metric that enables a meaningful comparison of different storage technologies, as well as between storage and non-storage solutions, in energy applications.
The standardization of the methods for calculating storage costs increases transparency and therefore helps to set the right level of expectations regarding the feasibility of energy storage solutions today. This will allow the market to weed out business cases where ESS is not feasible presently and focus on the already considerable – and consistently growing – number of economically viable projects. As a result, the energy storage industry as a whole would benefit from further increased confidence in ESS as a viable alternative to non-storage solutions.